Map Ramsey
It is recommended to view the website with the window maximized and Internet Explorer is not recommended and not fully supported.
Reports and Labels:
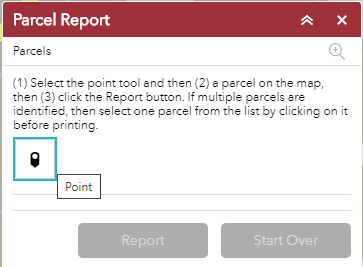
Parcel Report (for individual parcel)
1. Zoom in the map until the parcels appear.
2. Click on the Point tool to activate it
3. Then click on a parcel. The map will automatically center on the parcel and a red symbol will be placed in the center of the parcel.
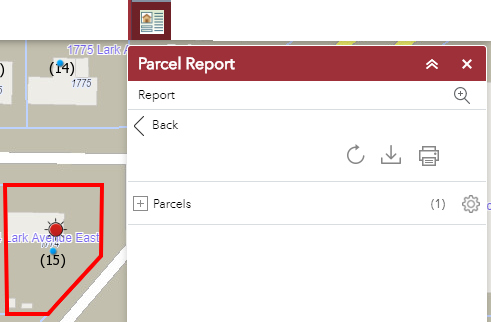
4. Next, click the Report button. A red outline will appear around the boundary of the parcel and information about the parcel will be collected.
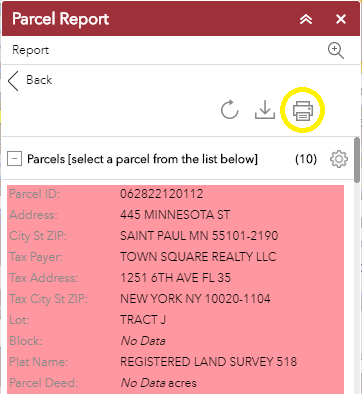
5. Click on the +Parcels to view information about the parcel. The number of parcels selected will appear to the right, like (1).
6. If more than one parcel is selected, then the list will automatically open and one parcel must be selected from the list in order to generate a report. The parcels should be sorted by Address. Select one parcel and it will turn red in the list.
7. Click the Print button on the Parcel Report tab.
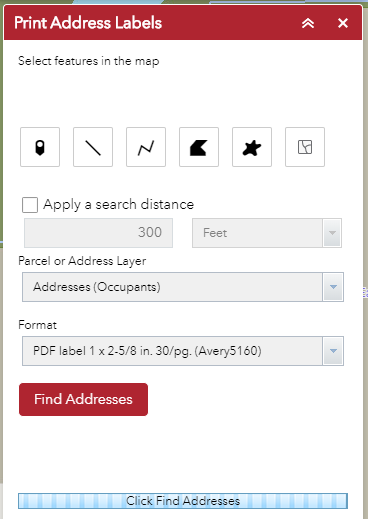
Print Address Labels ![]()
1. Select the type of label either Addresses (Occupants) or the Primary Tax Payer name and address. Addresses uses address point data, and Primary Tax Payer uses parcel polygon data.
2. Select a tool to select addresses.
3. Optionally, apply a search distance will add a buffer around the point, line, or polygon drawn.
4. Select the format, either PDF Avery 5160 (30 per page) or CSV file.
5.
The far-right button will clear the selection. 
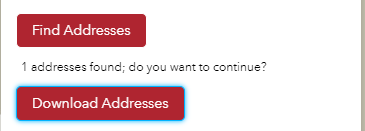
6. If the Addresses option is selected, then first, select the addresses desired using one of the selection tools. Address points may be turned on in the layer list (click the GIS Layers button on the top-right of the webpage) in order to view the point locations.
a. Next click the Find Addresses button.
b. The Download button will appear if addresses have been found.
c. The addresses selected will be highlighted on the map.
d. Click Download to create the PDF.
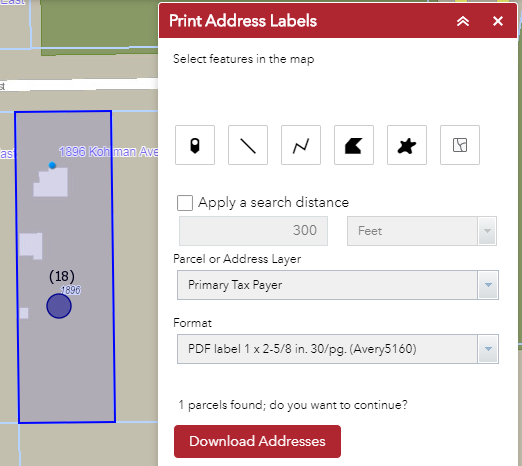
7.
If the Tax Payer option is selected, then first,
select the parcels desired using one of the selection tools, and next click the
Download button to create the PDF. The
parcels selected will be highlighted on the map.
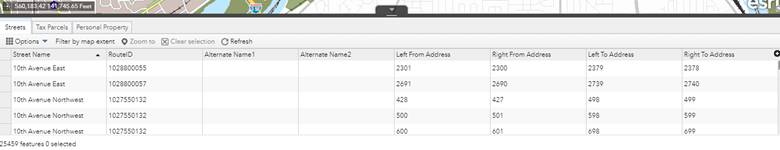
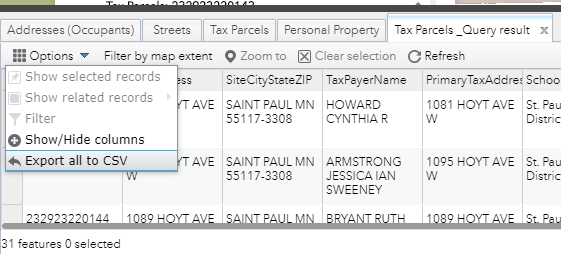
Attribute Table
The arrow-up tab at the bottom of the map will open the attribute table for Streets, Parcels, and Personal Property. Each layer is a separate tab. The total number of records (and records selected) are at the bottom-left.
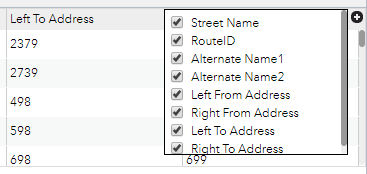
The + button on the top-right will open the list of
attributes and allow fields to be turned off.
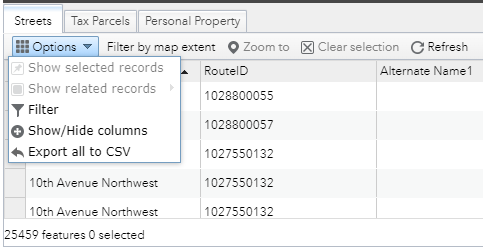
The Options on the top-left provide access to only Show
selected records, export to CSV, hide columns, and Filter records.
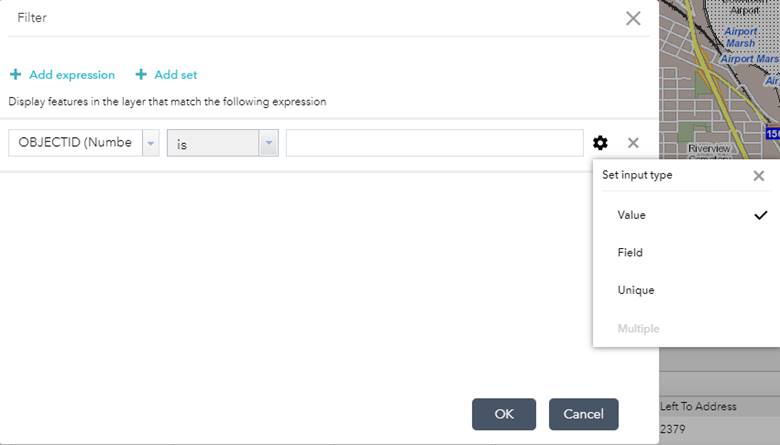
Build an expression to filter records.
Map Tools:
Identify
Click on the map to
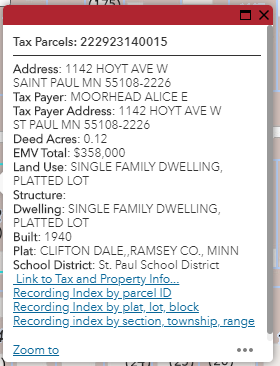
identify a particular feature (point, line, or polygon). Parcels will also include links to additional
information about the parcel.
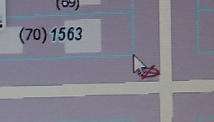
Example of a parcel
identify:
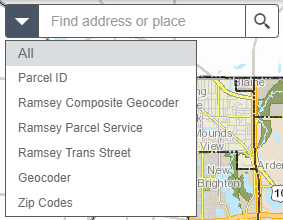
Search
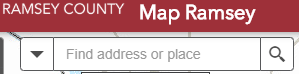
To find a particular address or parcel, type into the Search box, results should begin appearing for each type of search engine. You may also click the down-arrow and select a particular search engine. The map will pan and zoom to the location selected and a large red dot will appear at the address.
Spatial Select Features
2 layers have selectable features: Tax Parcels and Addresses.
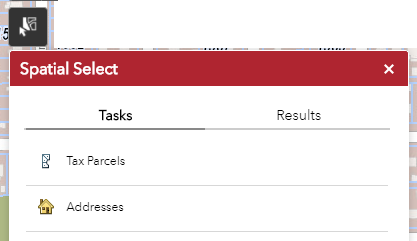
Select one of the layers (Tasks).
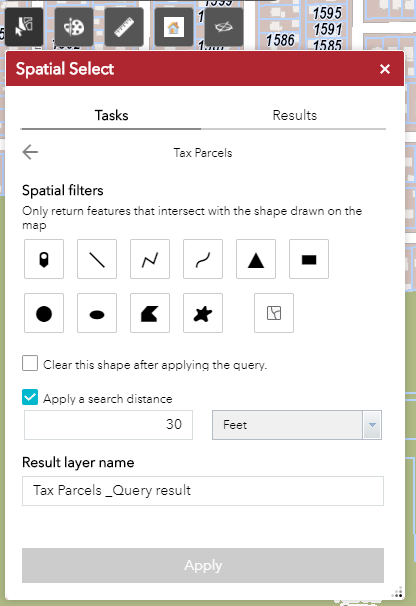
Select a tool to select features on the map. A buffer may also be applied (uncheck the Apply
a search distance to not use a buffer).
To clear the shape drawn, click the ![]() button, or check the box Clear this shape
after applying the query.
button, or check the box Clear this shape
after applying the query.
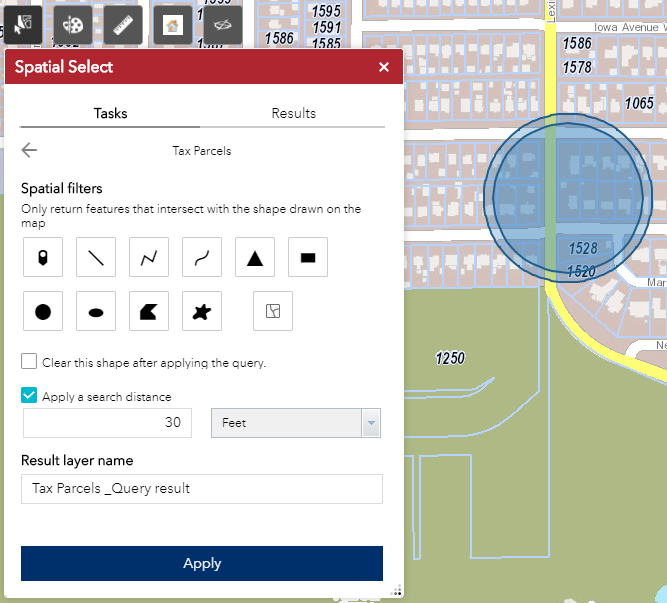
After the shape is drawn, the Apply button turns blue and becomes enabled. Click the Apply button.
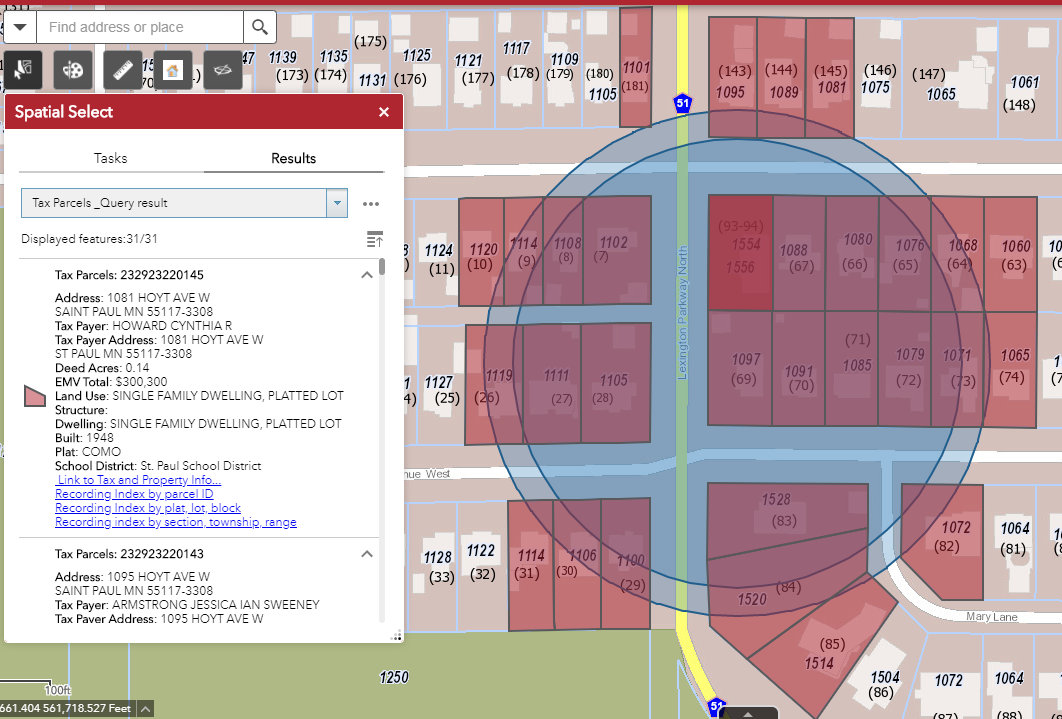
The map will zoom and center on the features selected, and the Results tab will display some of the key attributes of the features.
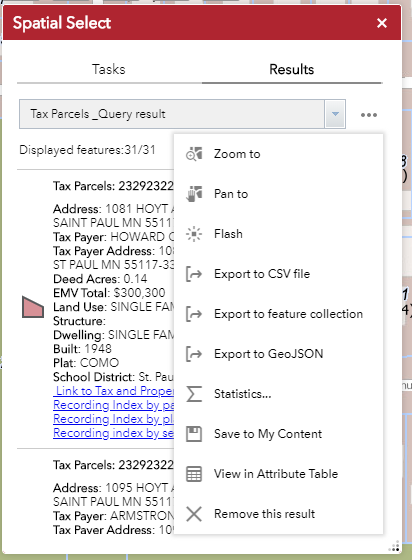
Additional tasks may be found by clicking on the ellipses (…).
· To de-select the features click Remove this result. Or close the Spatial Select window to de-select the features and remove the graphic.
· Save to My Content will put the selected features into a new layer in the layer list.
· Export to feature collection will create a json file to download.
· Use the Export to CSV file on this tab and not the one on the attribute table. The Tax Parcels_Query result is a virtual table so the Export all to CSV will not work from the attribute table tab.
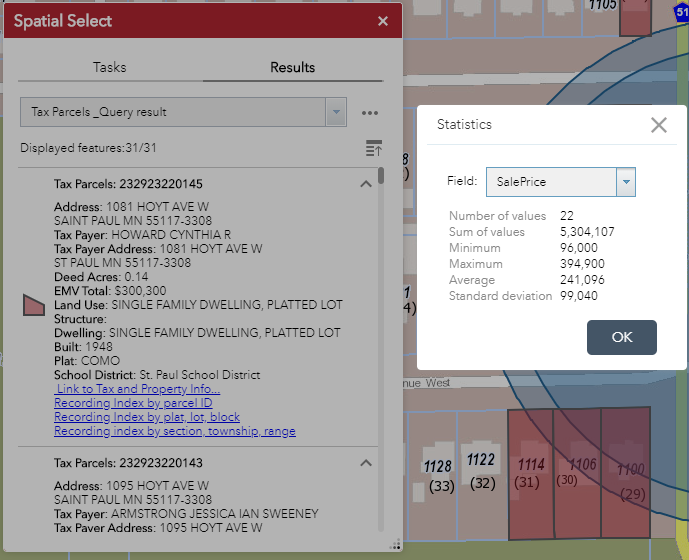
· Statistics will summarize numeric data.
Draw Graphic and Text on Map
Select a tool/draw mode, then draw on the map. Press CTRL to enable snapping. Use the scroll bar on the right of the popup window to view additional tools and setting. The popup may be repositioned by dragging the title bar, and the window may be resized from the lower-right corner. Press Clear to remove all graphics.
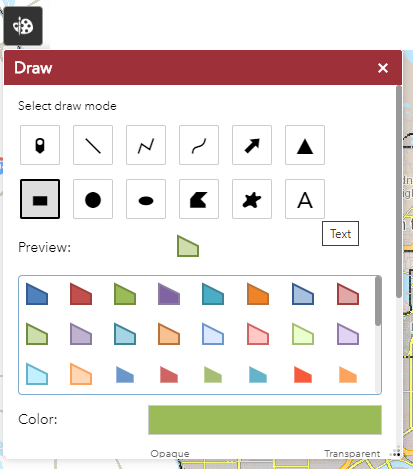
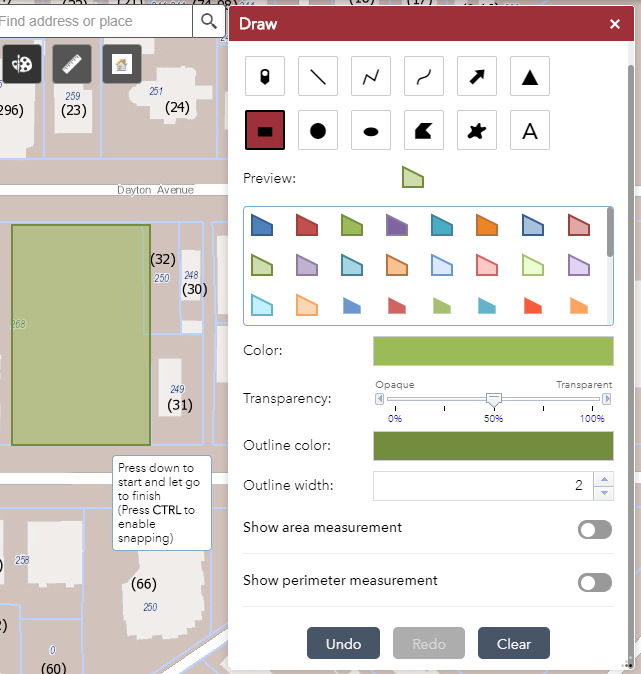
Graphics added to the map will automatically be added to the layer list, so they may be toggled on-and-off, and the transparency may be adjusted. These graphics are temporary, and the layers will disappear when the Clear button is clicked. The graphics map also be exported using the Select tool.
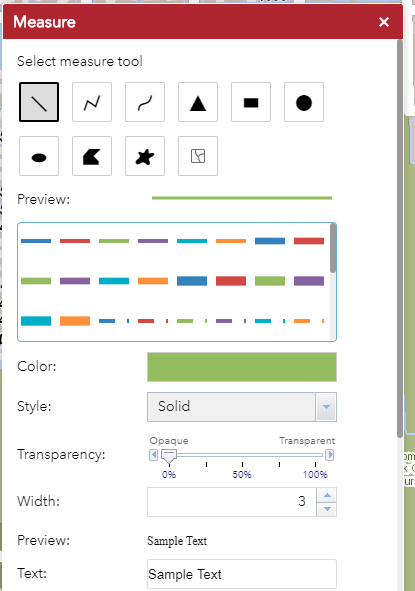
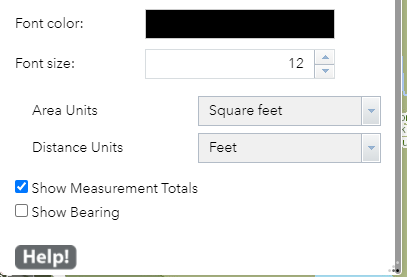
Measure
Use the measure tool to measure distance and area. Select a tool and draw on the map.
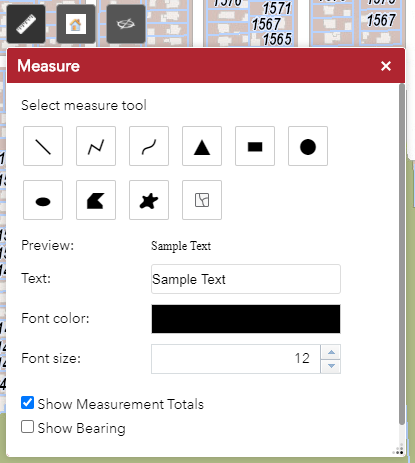
Color and transparency of the line, polygon fill, boundary may be adjusted, as well as the text color and size. Distance and area units may also be configured.
Click the clear button ![]() to clear the graphics.
to clear the graphics.
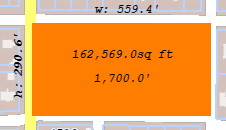
Example area measurement:
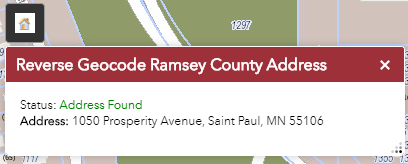
Reverse-Geocode
To find the address at a particular location, select this tool, then click on the map.
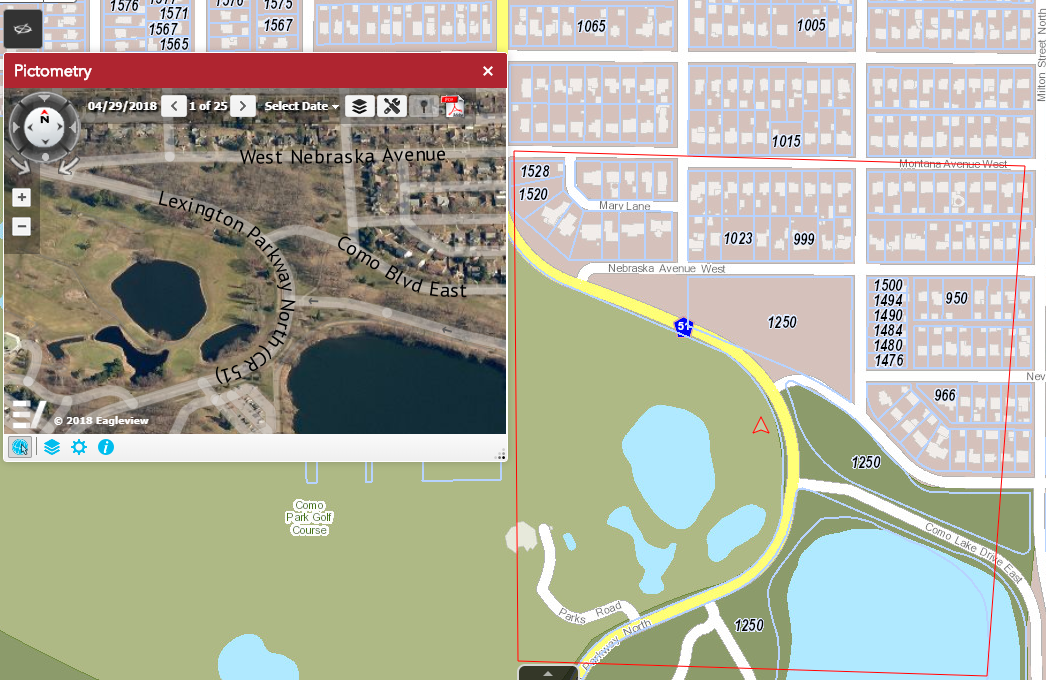
Pictometry
Pictometry is the provider of aerial oblique imagery for Ramsey County. After opening the Pictometry window, click on the map using the Pictometry tool.
The approximate extents of the imagery is shown on the map with the red outline, along with a directional arrow.
The date of the imagery may be changed by clicking on Select Date.
Additional layers may be viewed in the Pictometry window by clicking on the layers button in the Pictometry window.
Map Functions
Print Map
The MAP_ONLY layout will export the map image only to a variety of formats. The other layouts will include the legend, scale bar, date, attribution, and title into the export.
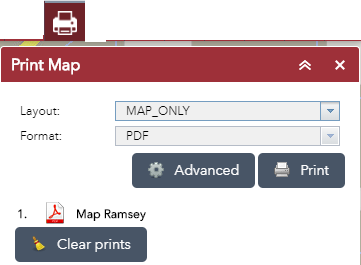
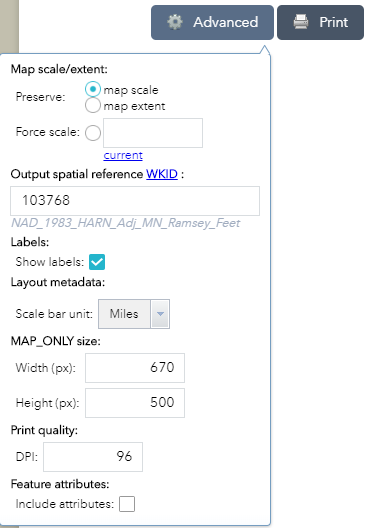
Other parameters may be adjusted by clicking the Advanced button.
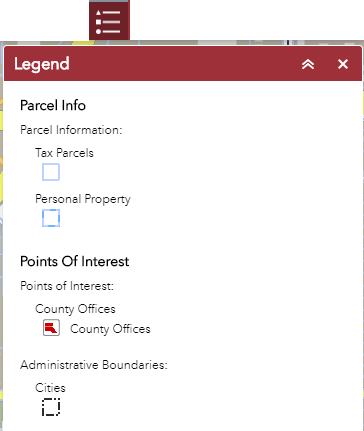
Legend
Contains symbology for the layers which are presently visible.
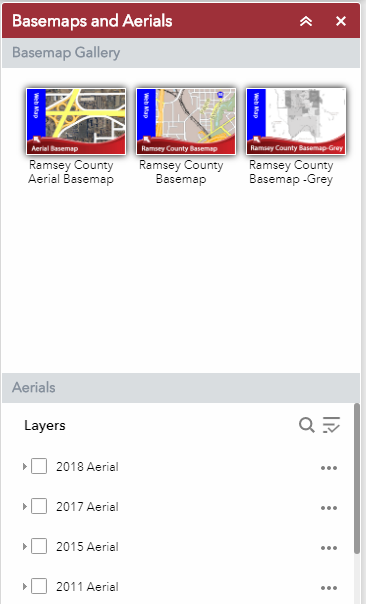
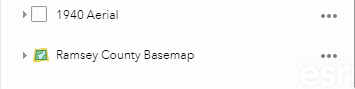
Basemaps and Aerials
The Basemap Gallery contains only three options because other public basemaps are not compatible with the Ramsey County projection. An Aerial may also be placed on top of the basemap. The transparency of the basemap and the aerial may be adjusted by clicking on the 3 dots (…) and selecting Transparency. The date of the Aerial Basemap is the same as the date of the most recent Aerial (raster) layer.
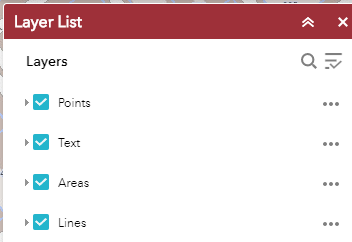
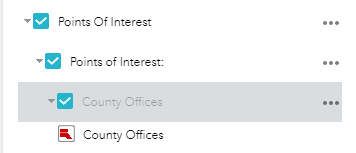
Layer List
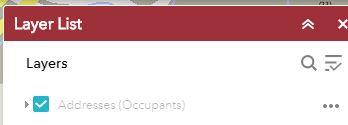
Click on the arrow to open a layer item and view sub-layers within a group, or the associated symbology. The transparency of each layer may be adjusted by clicking on the 3 dots (…) to the right of the layer.
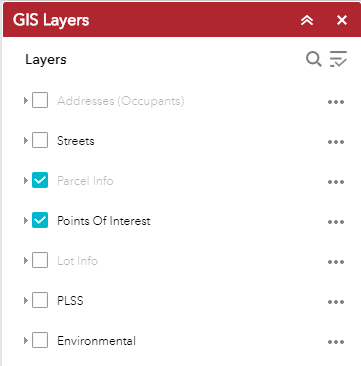
To find a particular layer click on the magnifier in the top-right of the Layer List and enter a keyword. This will limit the Layer List results. Click Cancel to view all layers.
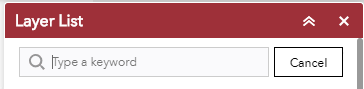
All layer groups may be expanded or collapsed.
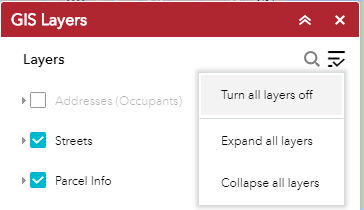
When a layer name is grayed-out, that means it is not visible at the current scale, in most cases you must zoom in closer for the layer to become visible.
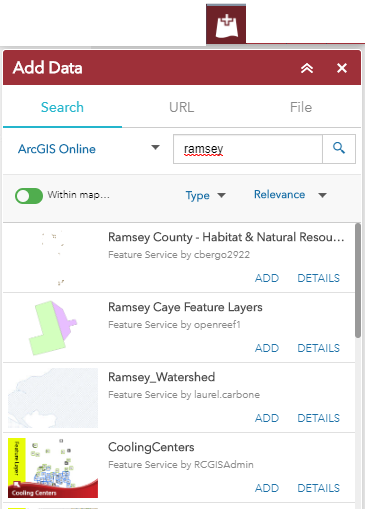
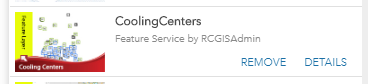
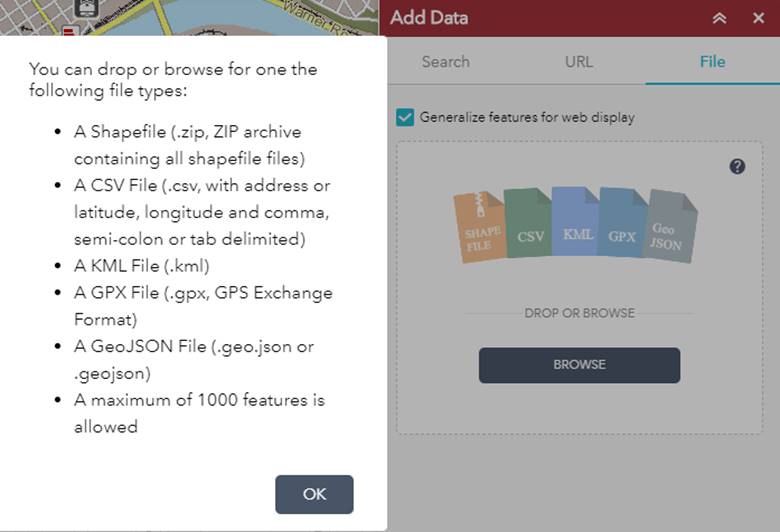
Add Data
Data layers may be added from ArcGIS Online, files, or web service. Logging into AGOL is not necessary to view publicly available services. To remove a layer, also use the Add Data dialog; once a layer is added, the ADD will change to REMOVE.
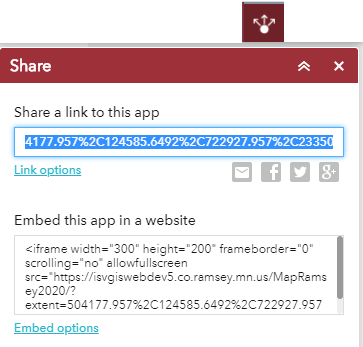
Share the map
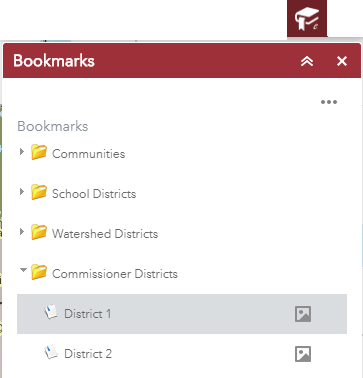
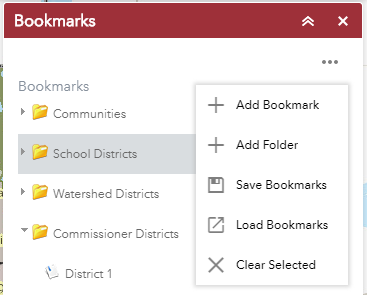
Bookmarks
Predefined bookmarks have been added for common areas. Click on the arrow to expand each list. Custom bookmarks may be added, saved, and imported.
Basic Navigation Tools are
found on the left-side of the site
![]() Plus and Minus will zoom-in or out respectively a fixed amount.
Plus and Minus will zoom-in or out respectively a fixed amount.
Zoom-in may also
be done by holding down the Shift-key and dragging a box on the map, then
release.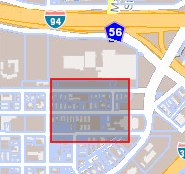
![]() The
Home button will zoom to the full,
maximum extent of the data.
The
Home button will zoom to the full,
maximum extent of the data.
![]() The
My Location button will only work
when connected to a GPS source, to zoom to the current location.
The
My Location button will only work
when connected to a GPS source, to zoom to the current location.
![]() The
Full Screen button will allow the
site to fill the entire screen. Press
ESC to return to normal.
The
Full Screen button will allow the
site to fill the entire screen. Press
ESC to return to normal.
![]() Move Back and Move Forward to Previous or Next extents.
Move Back and Move Forward to Previous or Next extents.
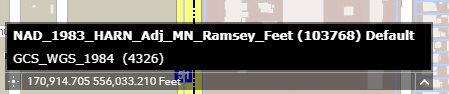
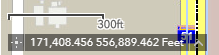
Scale Bar and Coordinates
In the lower-left corner of the map is the scale bar and the
coordinates change as the cursor is moved around the map (y,x). The
default coordinates are in feet using the NAD_1983_HARN_Adj_MN_Ramsey_Feet
projection.
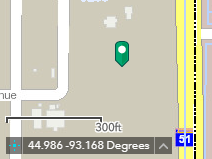
To find the coordinates of a point on the map in decimal degrees, click on the arrow-up to the right of the coordinates, and select the GCS_WGS_1984. Then click on the star/plus symbol to the left of the coordinates, then click on a location on the map. An icon will be dropped on the map and the latitude and longitude will appear on the coordinates window.